
Once your solar array is installed, it is easy to forget about it until you receive your monthly utility bill, which now should be a much more pleasant experience thanks to the money you are saving with your solar panels. However, we recommend routinely monitoring your array’s production. While most of the time your solar array will work as expected and you won’t experience any problems, occasionally glitches do happen. If you tend to only check your array when you look at your utility bill, an entire month may go by before you notice that your solar array is not producing or is under producing energy. Routinely checking how much power your array is producing and familiarizing yourself with monthly and daily averages throughout the year will enable you to spot potential problems quickly and easily. Responding quickly is the key to getting your solar array back up and running as soon as possible.
When monitoring your solar array’s energy production, you can use either your inverter manufacturer’s solar monitoring system or you can find the information through your electric provider using their online account platforms. The advantage of using the electric provider’s monitoring tools is that the kWh (kilowatt hours) they report are the exact numbers that you will be billed and credited for. Most of our customers have Green Mountain Power as their electric provider. Below we go step by step through the process of checking your solar array production using Green Mountain Power’s website.
- Go to Green Mountain Power’s website – https://greenmountainpower.com
- Click on “My Account”
- Login using your Green Mountain Power login information. This step may not be necessary if you have remained logged in from previous sessions. Likewise, if you haven’t used GMP’s website before, GMP may prompt you to set up an account using your account # from your bill and the phone number used to set up your account.
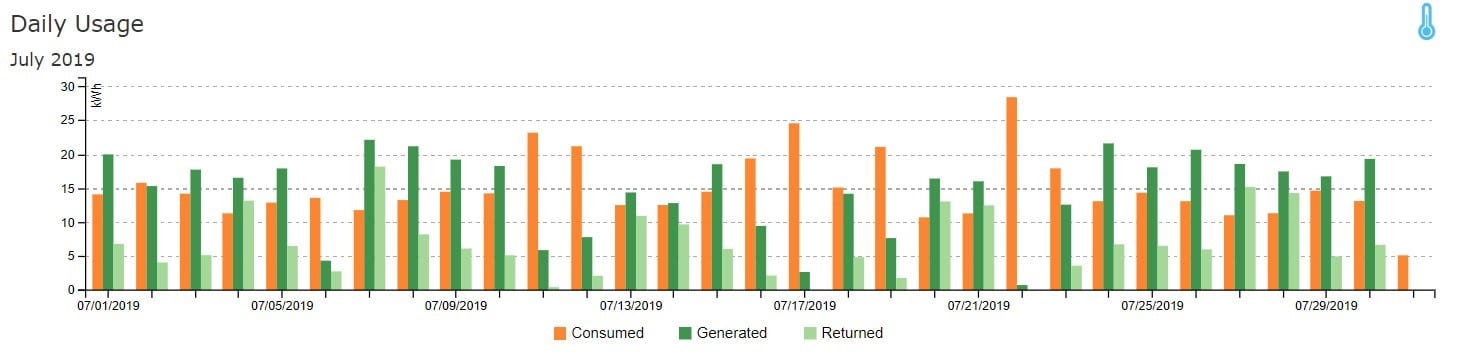
- When the “My Account” page opens, you should see information about your account. If you scroll down the page a little bit you should see a chart that looks something like this:


Chart Terms:
Consumed (Orange Bars) – The amount of energy your household or business pulled from the grid. This does not necessarily reflect how much energy was required to run your household during the given time period, as it does not count energy that you used from your array.
Generated (Dark Green Bars) – Total amount of energy produced by your solar array.
Returned (Light Green Bars) – The amount of energy produced by your solar array that was not consumed by your household, and therefore, was returned to the grid. This amount is recorded on your account as “excess generation.”
- Click on the bar for the current month and it will open a new graph that will look something like this:

- A few things to keep an eye out for are no production on days you know were sunny and if there is no production for several days in a row.
Keeping track of your production is the first step in ensuring that your solar array is producing clean energy year-round. If you notice a potential issue, call us. Same Sun of Vermont’s Solar ProFormance Services, LLC provides maintenance and repairs on existing solar arrays, servicing Vermont, New York, and New Hampshire. You can contact Solar ProFormance Services at (802) 775-7900. If you are outside of our servicing area, you can call the manufacturer of your inverter for a list of local solar companies that service your area.

